The following is a listing of the W&A match-up of the DPD tape with the 'grassy knoll' rifle echoes. The red figures show numbers that seem justifiable. The one blue one was rejected by W&A. ( More than 1 ms from echo) . The others all have various problems - in many cases, the numbers below seem to have been simply created out of nowhere.
TABLE 4.--MEASURED DELAY TIMES OF IMPULSES AND PREDICTED DELAY TIMES OF GUNSHOT ECHOES FOR
NOV. 22, 1963. [in milliseconds]
| Echo path | Echo travel time | Echo delay time | Impulse delay time | Deviation |
| 1 | 202.4 | 6.5 | 6.3 | -0.2 |
| 2 | 206.8 | 10.9 | 10.5 | -.4 |
| 3 | 211.0 | 15.1 | 14.7 | -.4 |
| 4 | 214.7 | 18.8 | 19.3 | .5 |
| 5 | 217.0 | 21.1 | 20.1 | -1.0 |
| 6 | 224.3 | 28.4 | 27.4 | -1.0 |
| 7 | 225.2 | 29.3 | 30.3 | 1.0 |
| 8 | 227.1 | 31.2 | 31.6. | .4 |
| 9 | 230.6 | 34.7 | 34.1 | -.6 |
| 10 | 244.1 | 48.2 | 48.7 | .5 |
| 11 | 241.5 | 45.6 | 45.4 | -.2 |
| 12 | 250.3 | 54.4 | 54.2 | -.2 |
| 13 | 255.2 | 59.3 | 59.7 | .4 |
| 14 | 266.0 | 70.1 | 69.4 | -.7 |
| 15 | 273.4 | 77.5 | 77.4 | -.1 |
| 16 | 281.8 | 85.9 | 85.3 | .6 |
| 17 | 276.7 | 80.8 | 80.2 | -.6 |
| 18 | 473.9 | 278.0 | 278.6 | .6 |
| 19 | 479.8 | 283.9 | 283.7 | -.2 |
| 20 | 479.8 | 283.9 | 283.7 | -.2 |
| 21 | 489.1 | 293.9 | 292.1 | -1.1 |
| 22 | 506.8 | 310.9 | 310.5 | -.4 |
| 23 | 507.9 | 312.0 | 312.4 | .4 |
| 24 | 509.6 | 313.7 | 313.1 | -.6 |
| 25 | 524.0 | 328.1 | 327.5 | -.6 |
| 26 | 565.0 | 369.1 | 369.2 | .1 |
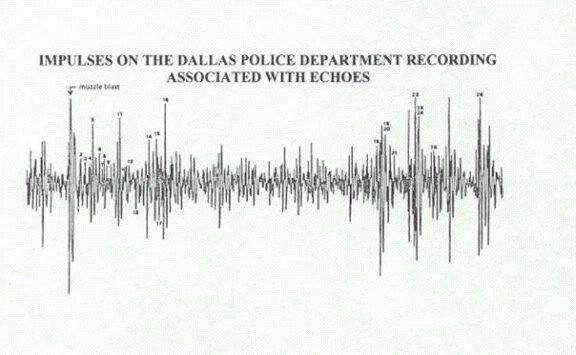
The matches are also illustrated here :
The lateral compression of this image (above) has always made interpretation of it difficult. I used a computer
program to spread the wave form out laterally, and also to add the times of the known gunshot echoes, as below
& et seq.
The red dots mark the (computed) echo arrival times, superimposed on a picture of the start of the relevant part
of the DPD tape, with the initial echo and impulses synchronised. The seven vertical bars at the bottom centre
show 1 msec intervals.
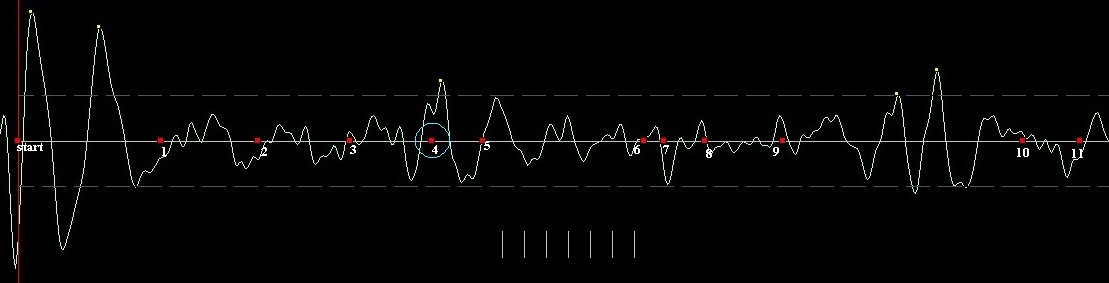
"The data in table 4 suggest that the sequence of impulses on the DPD recording is very similar to the sequence of predicted echoes. A visual comparison indicates that almost all of the impulses and echoes coincide within a window of +/-1 millisecond. " (BB&N, Analysis of Recorded Sounds).
Where, then, is this supposed 'similarity' ?
Simply looking at the picture above, it is, in fact, extremely hard to find any possible candidate matching
impulses for echoes such as (for eg) #s 2 , 3 , 6 , 7 , 8 & 9. In light of this , one wonders how W&A arrived
at their conclusions about the exact times of the impulses on the tape. (Was it - heaven forbid - by eyeballing
such impossible-to-read temporally 'crushed' print-outs, such as the one from their report, reproduced 2 pictures
above?) They simply don't seem to match reality. The data in table 4 is indeed very similar to the sequence of
predicted echoes, but the data bears very little obvious relation to the actual waveform. There are positive or
negative peaks of some description at roughly 1 ms intervals from #1 to # 9, for eg, so that it will almost
always be possible to find some 'peak' that can be assumed to match any given echo, to within
about 1 ms.
The table below shows the supposed matches ( to within 1 ms) obtained by W&A. My comments follow for each supposed 'match' in the last column.
Table below refers to above picture.
| Echo path | Echo travel time | Echo delay time | Impulse delay time | Deviation | Comment |
| 1 | 202.4 | 6.5 | 6.3 | -0.2 | There appears to be nothing to substantiate this 'match' except possibly the negative going impulse 1 ms or so previous. |
| 2 | 206.8 | 10.9 | 10.5 | -.4 | Ditto. |
| 3 | 211.0 | 15.1 | 14.7 | -.4 | Ditto |
| 4 | 214.7 | 18.8 | 19.3 | .5 | OK |
| 5 | 217.0 | 21.1 | 20.1 | -1.0 | Possibly ok |
| 6 | 224.3 | 28.4 | 27.4 | -1.0 | Possible, if matched to the negative impulse just under # 7. |
| 7 | 225.2 | 29.3 | 30.3 | 1.0 | Possible, to the negative impulse just under # 7, but obviously not if #6 is also so matched |
| 8 | 227.1 | 31.2 | 31.6. | 4 | Almost possible, but not if 6 or 7 are matched. |
| 9 | 230.6 | 34.7 | 34.1 | -.6 | There appears to be nothing to substantiate this 'match'. |
| 10 | 244.1 | 48.2 | 48.7 | .5 | Ditto |
| 11 | 241.5 | 45.6 | 45.4 | -.2 | Possible, with a low enough threshold. |
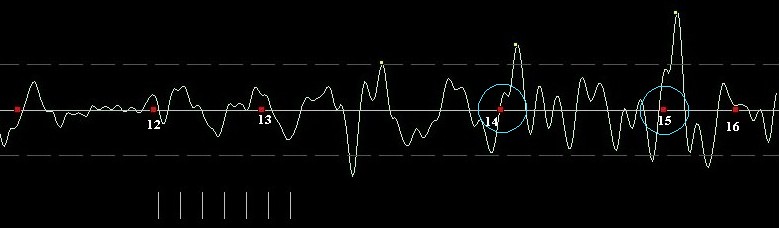
Table below refers to above picture.
| Echo path | Echo travel time | Echo delay time | Impulse delay time | Deviation | Comment |
| 12 | 250.3 | 54.4 | 54.2 | -.2 | There appears to be nothing to substantiate this 'match'. |
| 13 | 255.2 | 59.3 | 59.7 | .4 | There appears to be nothing to substantiate this 'match'. |
| 14 | 266.0 | 70.1 | 69.4 | -.7 | OK |
| 15 | 273.4 | 77.5 | 77.4 | -.1 | OK |
| 16 | 281.8 | 85.9 | 85.3 | -.6 | Concievable, if we allow the negative impulse about 1 ms before. |
"Obvious question; what happened to the other two coincidences reported by the HSCA? These can be accounted
for by the anomalies that still exist in the Sensimetrics program.
Note in the Bowles version of the DPD pattern (Fig. 2) there is an impulse numbered 16 which is much larger than
the adjacent impulses numbered 14 and 15. It is one of the largest two or three impulses in the whole pattern.
In the Sensimetrics waveform, the same impulse falls below the S/N threshold, now much lower than the adjacent
impulses. By lowering the S/N threshold to capture 18 impulses (a setting of around 5800), this impulse now matches
to one of the echo paths defined by the HSCA study (No.16 in their table 4). This was probably the ninth coincidence
identified by the HSCA." ( DonThomas "Impulsive Behavior:")
In fact, the impulse Thomas refers to is not inexplicably absent or 'cropped' in the HSC.wav file that comes
with the 'Impulses' program, but alive & well . It is matched to echo # 15 in the diagram just above. (The
highest spike in that picture).
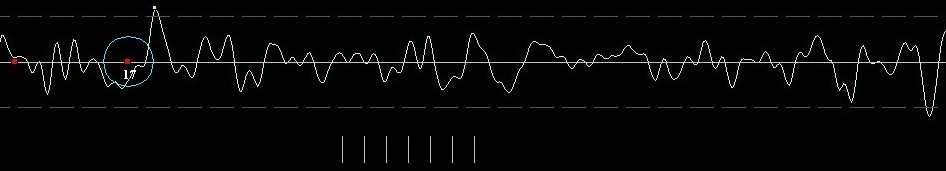
Table below refers to above picture.
| Echo path | Echo travel time | Echo delay time | Impulse delay time | Deviation | Comment |
| 17 | 276.7 | 80.8 | 80.2 | .6 | Probably OK |
The next few images show the middle of the relevant section, with no echoes & virtually no impulses, at least with a threshold of 5000, as here. They are included for completeness, so that all these images strung together would form a continuous ( highly elongated) map of the DPD tape section shown in the W&A illustration over a mere few illegible inches of space.
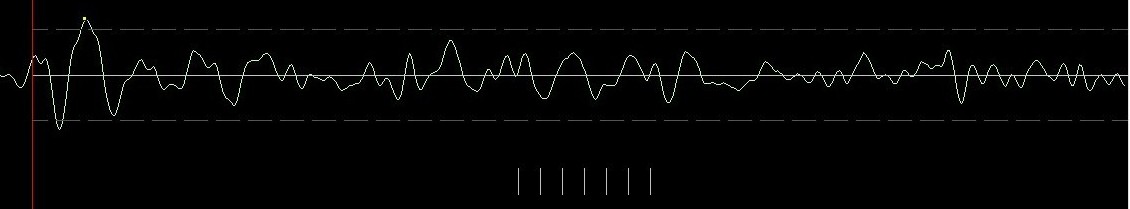
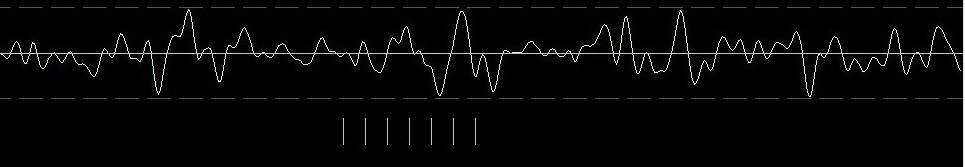
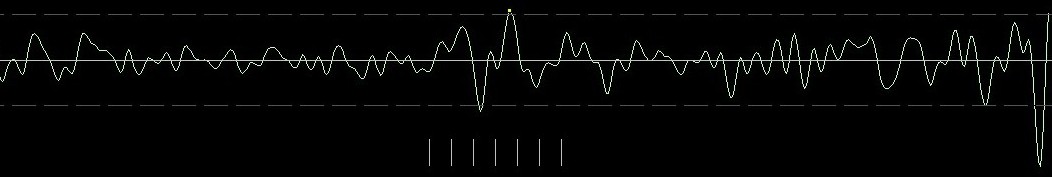
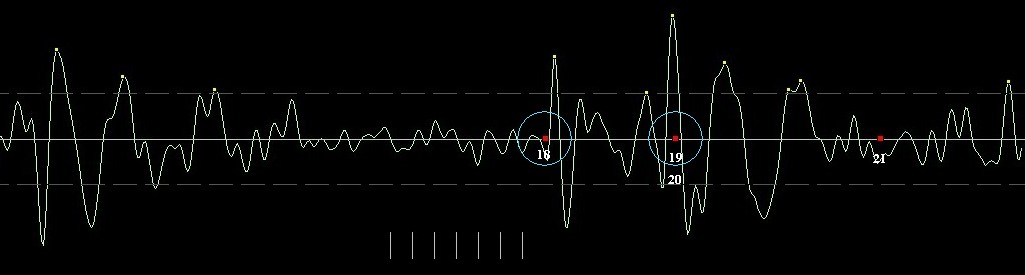
Table below refers to above picture.
| Echo path | Echo travel time | Echo delay time | Impulse delay time | Deviation | Comment |
| 18 | 473.9 | 278.0 | 278.6 | .6 | OK |
| 19 | 479.8 | 283.9 | 283.7 | .2 | OK if not also 20- otherwise we are getting 2 matched for the price of one. |
| 20 | 479.8 | 283.9 | 283.7 | .2 | OK if not also 19 - otherwise we are getting 2 matched for the price of one. |
| 21 | 489.1 | 293.9 | 292.1 | 1.1 | Unusually, not even claimed by W&A as a match |
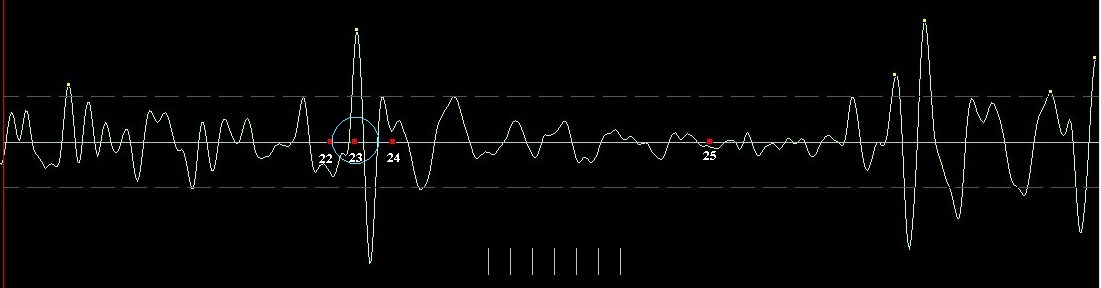
Table below refers to above picture.
| Echo path | Echo travel time | Echo delay time | Impulse delay time | Deviation | Comment |
| 22 | 506.8 | 310.9 | 310.5 | .4 | OK if not 23 |
| 23 | 507.9 | 312.0 | 312.4 | .4 | OK if not 22 |
| 24 | 509.6 | 313.7 | 313.1 | .6 | There appears to be nothing to substantiate this 'match'. |
| 25 | 524.0 | 328.1 | 327.5 | .6 | There appears to be nothing to substantiate this 'match'. |
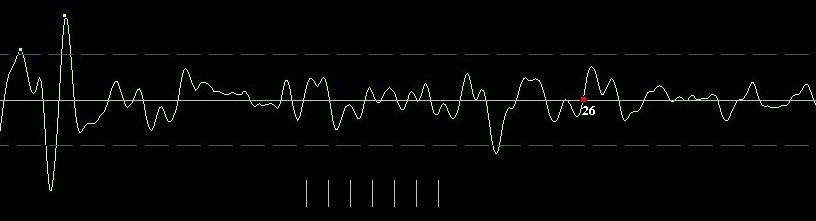
Table below refers to above picture.
| Echo path | Echo travel time | Echo delay time | Impulse delay time | Deviation | Comment |
| 26 | 565.0 | 369.1 | 369.2 | .1 | There appears to be nothing to substantiate this supposed 'match'. |
This leaves us with the eight matches indicated in bold, above. Varying the threshold may possibly gain
a match or two, but only at the cost of adding many more impulses that do not match any echoes, thus reducing the
resulting correlation coefficient.
As it stands, we would appear to have around 8 matches, around 22 impulses above the threshold, and 26 echoes to match.
This results in a cc of 8 / sqrt( 22*26) = ~ 0.33.
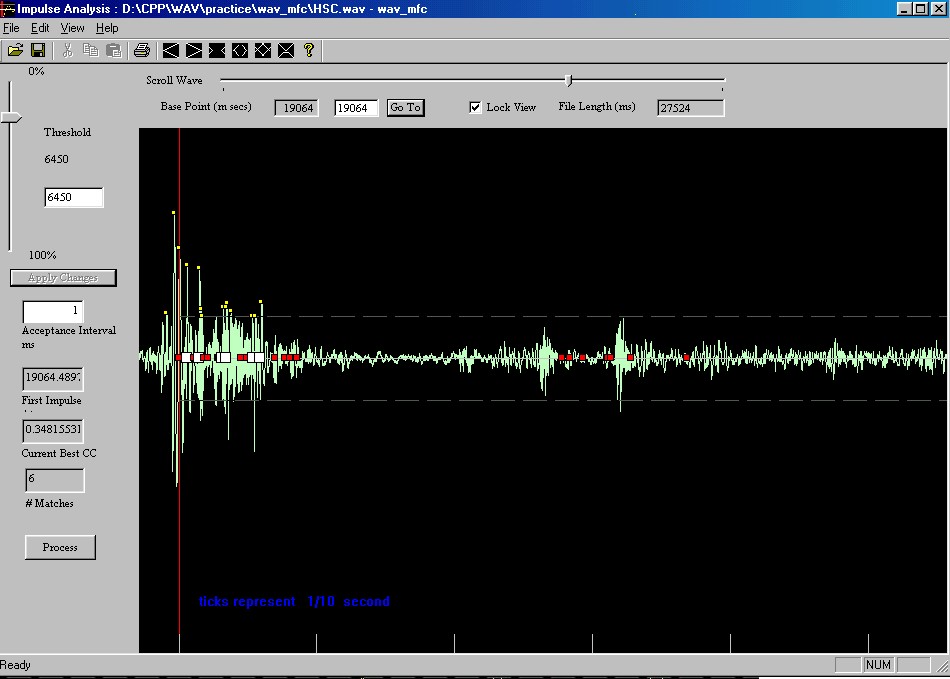
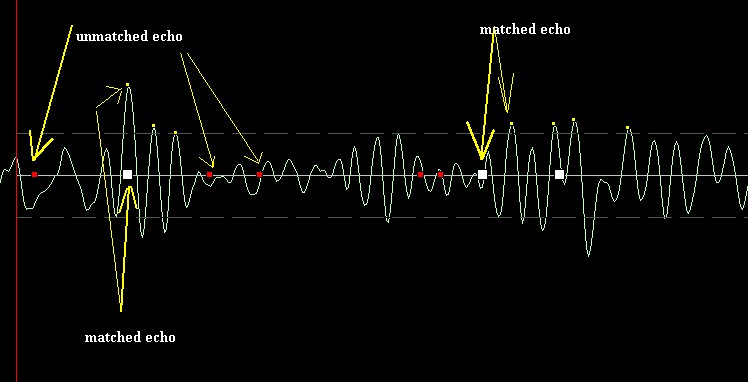
The program which produced these images can also analyse any wave form sequentially in steps of about 1/22000 sec. A screen shot is shown below. The red dots show unmatched echoes, the white dots show matched echoes. The dashed horizontals show the threshold. The view can be magnified vertically and horizontally until a single millisecond ( about 22 digital samples) takes up about 1/2 the black window area. Thus extreme detail can be picked out. The program can run over all 27 seconds of the HSC.wav file ( or any other wav file) searching for the best matches to the 'grassy knoll' echo pattern ( or any other such pattern). The results can be automatically printed to file. Below the screenshot is a section of one or two readouts.
Below is the result for the supposed grassy knoll shot at 15.257 seconds :
( there follow 7 sets of matching echo & impulse times )
[ECHO TIME(ms)] [ECHO (time split]
[IMPULSE MATCH(ms)] [IMPULSE (time split)]
[15276.487075] [start time + 18.800000]
[15276.281179] [start time + 18.594104]
[15327.787075] [start time + 70.100000]
[15327.891156] [start time + 70.204082]
[15335.187075] [start time + 77.500000]
[15335.147392] [start time + 77.460317]
[15343.587075] [start time + 85.900000]
[15344.217687] [start time + 86.530612]
[15535.687075] [start time + 278.000000]
[15535.510204] [start time + 277.823129]
[15541.587075] [start time + 283.900000]
[15540.861678] [start time + 283.174603]
[15568.587075] [start time + 310.900000]
[15569.160998] [start time + 311.473923]
START TIME IS AT:15257.687075 (ms) for this match
There are 7 matches
over a time interval 370.000000 milliseconds
There are 25 impulses above threshold
There are 27 echoes in the test pattern
The correlation coefficient is 0.269430
W&A's 'match' table is repeated below, with the actual matches found by the program shown in
bold :
| Echo path | Echo travel time | Echo delay time | Impulse delay time | Deviation |
| 1 | 202.4 | 6.5 | 6.3 | -0.2 |
| 2 | 206.8 | 10.9 | 10.5 | -.4 |
| 3 | 211.0 | 15.1 | 14.7 | -.4 |
| 4 | 214.7 | 18.8 | 19.3 | .5 |
| 5 | 217.0 | 21.1 | 20.1 | -1.0 |
| 6 | 224.3 | 28.4 | 27.4 | -1.0 |
| 7 | 225.2 | 29.3 | 30.3 | 1.0 |
| 8 | 227.1 | 31.2 | 31.6. | .4 |
| 9 | 230.6 | 34.7 | 34.1 | -.6 |
| 10 | 244.1 | 48.2 | 48.7 | .5 |
| 11 | 241.5 | 45.6 | 45.4 | -.2 |
| 12 | 250.3 | 54.4 | 54.2 | -.2 |
| 13 | 255.2 | 59.3 | 59.7 | .4 |
| 14 | 266.0 | 70.1 | 69.4 | -.7 |
| 15 | 273.4 | 77.5 | 77.4 | -.1 |
| 16 | 281.8 | 85.9 | 85.3 | .6 |
| 17 | 276.7 | 80.8 | 80.2 | -.6 |
| 18 | 473.9 | 278.0 | 278.6 | .6 |
| 19 | 479.8 | 283.9 | 283.7 | -.2 |
| 20 | 479.8 | 283.9 | 283.7 | -.2 |
| 21 | 489.1 | 293.9 | 292.1 | -1.1 |
| 22 | 506.8 | 310.9 | 310.5 | -.4 |
| 23 | 507.9 | 312.0 | 312.4 | .4 |
| 24 | 509.6 | 313.7 | 313.1 | -.6 |
| 25 | 524.0 | 328.1 | 327.5 | -.6 |
| 26 | 565.0 | 369.1 | 369.2 | .1 |
The following example shows a much better result for a match at 24.849 seconds. The correlation coeff ( 0.401286 ) was the best obtainable, using a threshold of 5000, only positive peak matching, & an acceptance interval of 1 ms.
WAVE FILENAME "HSC.wav"
THRESHOLD 5000
ACCEPTANCE INTERVAL 1.000000
( there follow 10 sets of matching echo & impulse times )
[ECHO TIME(ms)] [ECHO (time split]
[IMPULSE MATCH(ms)] [IMPULSE (time split)]
[24856.477324] [start time + 6.500000]
[24856.235828] [start time + 6.258503]
[24860.877324] [start time + 10.900000]
[24860.952381] [start time + 10.975057]
[24865.077324] [start time + 15.100000]
[24864.126984] [start time + 14.149660]
[24868.777324] [start time + 18.800000]
[24868.027211] [start time + 18.049887]
[24871.077324] [start time + 21.100000]
[24871.383220] [start time + 21.405896]
[24878.377324] [start time + 28.400000]
[24878.820862] [start time + 28.843537]
[24879.277324] [start time + 29.300000]
[24879.818594] [start time + 29.841270]
[24881.177324] [start time + 31.200000]
[24880.725624] [start time + 30.748299]
[24884.677324] [start time + 34.700000]
[24884.535147] [start time + 34.557823]
[24909.277324] [start time + 59.300000]
[24909.297052] [start time + 59.319728]
START TIME IS AT:24849.977324 (ms) for this match
There are 10 matches
over a time interval 370.000000 milliseconds
There are 23 impulses above threshold
There are 27 echoes in the test pattern
The correlation coefficient is 0.401286
Don Thomas has suggested that using a threshold of 5800 might be useful for the supposed 15.257 'shot '.
Here's the actual result : still only 7 matches, but a cc of 0.317526 :
WAVE FILENAME "HSC.wav"
THRESHOLD 5800
ACCEPTANCE INTERVAL 1.000000
[15276.487075] [start time + 18.800000]
[15276.281179] [start time + 18.594104]
[15327.787075] [start time + 70.100000]
[15327.891156] [start time + 70.204082]
[15335.187075] [start time + 77.500000]
[15335.147392] [start time + 77.460317]
[15343.587075] [start time + 85.900000]
[15344.217687] [start time + 86.530612]
[15535.687075] [start time + 278.000000]
[15535.510204] [start time + 277.823129]
[15541.587075] [start time + 283.900000]
[15540.861678] [start time + 283.174603]
[15568.587075] [start time + 310.900000]
[15569.160998] [start time + 311.473923]
START TIME IS AT:15257.687075 (ms) for this match
There are 7 matches
over a time interval 370.000000 milliseconds
There are 18 impulses above threshold
There are 27 echoes in the test pattern
The correlation coefficient is 0.317526
Paul Seaton
24th May 2004